What You'll Learn
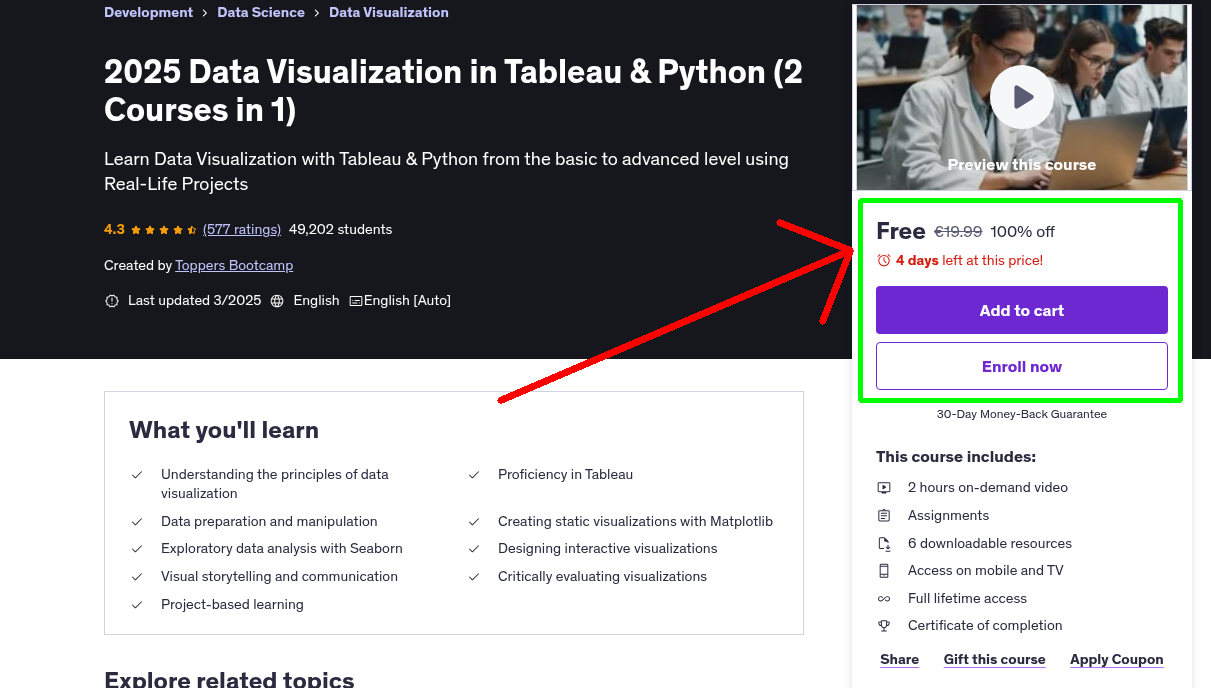
- Understanding the principles of data visualization
- Proficiency in Tableau
- Data preparation and manipulation
- Creating static visualizations with Matplotlib
- Exploratory data analysis with Seaborn
- Designing interactive visualizations
- Visual storytelling and communication
- Critically evaluating visualizations
- Project-based learning
Requirements
- Proficiency in Python: Since Matplotlib and Seaborn are Python libraries, a solid understanding of Python programming is necessary. Students should have a good grasp of Python syntax, variables, data structures (such as lists, dictionaries, and arrays), control flow (loops and conditionals), functions, and file I/O operations.
- Knowledge of data manipulation: It is beneficial to have some experience with data manipulation and cleaning techniques, such as loading data from different file formats (CSV, Excel, etc.), handling missing values, and performing basic data transformations (filtering, grouping, merging, etc.). This can be achieved through libraries like pandas.
Who This Course is For
- Data Analysts: Professionals working in data analysis roles who want to enhance their data visualization skills. They may already have experience with data manipulation and analysis and want to effectively communicate their findings through visually engaging charts and graphs.
- Data Scientists: Individuals involved in data science who wish to add data visualization to their skill set. They understand the importance of effective data communication and want to leverage visualization techniques to convey complex insights to a non-technical audience.
- Business Intelligence Professionals: Those responsible for collecting, analyzing, and presenting data to support decision-making in an organization. They seek to develop expertise in creating interactive dashboards and visualizations using Tableau, Matplotlib, and Seaborn.
- Researchers and Academics: Researchers, scientists, and academics from various domains who deal with large datasets. They want to learn how to visually explore and communicate their data effectively, enabling them to present their findings in a visually compelling manner.
- Data Enthusiasts: Individuals who have a strong interest in data visualization and want to explore the power of Tableau, Matplotlib, and Seaborn to create impactful visualizations. They may come from diverse backgrounds and want to acquire practical skills to showcase data in a meaningful way.
- Students and Aspiring Data Professionals: Students pursuing degrees or courses in data-related fields, such as data science, analytics, or business intelligence. They aim to acquire a comprehensive understanding of data visualization techniques early in their careers to excel in their future roles.
Your Instructor
Toppers Bootcamp
Udemy's Best Instructors
4.3 Instructor Rating
12,362 Reviews
335,101 Students
42 Courses
Related Courses
More free Python courses you might be interested in
 Free 100% Off
12 January 2026
Limited Time
Free 100% Off
12 January 2026
Limited Time
Ultimate Python Game Development 2025 : From Zero To Gamer
Learn Python Game Development Step-by-Step | Real Python Game Development Projects | Complete Pytho…
 Free 100% Off
02 January 2026
Limited Time
Free 100% Off
02 January 2026
Limited Time
Build Realtime Data Dashboard With AWS,Python,Kafka,Grafana
Beginner-friendly, step-by-step project to stream, store, and visualize data using AWS EC2, Python,…
 Free 100% Off
13 November 2025
Limited Time
Free 100% Off
13 November 2025
Limited Time
Master Python Programming Visually for Non-IT – in Tamil
Learn Python Programming in 6 Weeks in Tamil : Visualize How Code Executes in RAM, Clear Understand…
Free 100% Off
13 November 2025
Limited Time
Learn Python Visually for Non-IT Students – in Tamil
Learn Python in 6 Weeks in Tamil : Visualize How Code Executes in RAM for Effortless, Clear Underst…
Never Miss a Coupon!
Subscribe to our newsletter to get daily updates on the latest free courses.