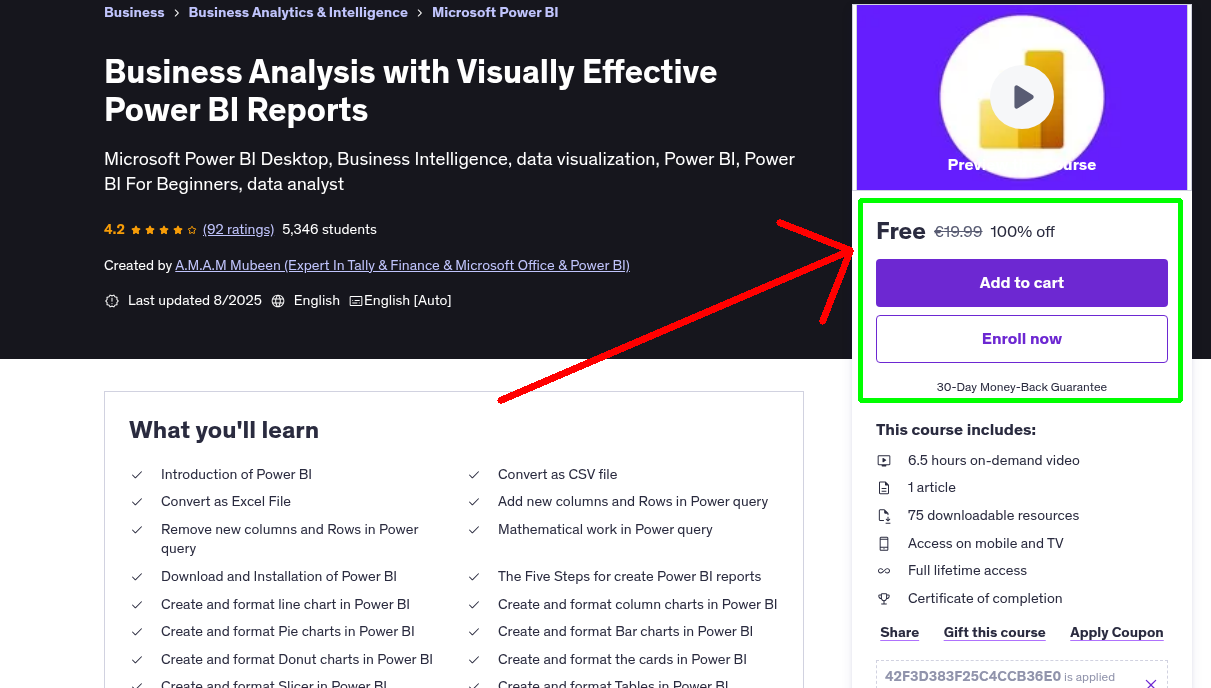
What You'll Learn
- Introduction of Power BI
- Convert as CSV file
- Convert as Excel File
- Add new columns and Rows in Power query
- Remove new columns and Rows in Power query
- Mathematical work in Power query
- Download and Installation of Power BI
- The Five Steps for create Power BI reports
- Create and format line chart in Power BI
- Create and format column charts in Power BI
- Create and format Pie charts in Power BI
- Create and format Bar charts in Power BI
- Create and format Donut charts in Power BI
- Create and format the cards in Power BI
- Create and format Slicer in Power BI
- Create and format Tables in Power BI
- Export the Power BI Report as PDF
- Create and format Stacked column charts in Power BI
- Create and format Funnel charts in Power BI
- Create and format Stacked Bar charts in Power BI
- Connect website data into Power BI
- Analysis & create the report by using website data
Requirements
- A Computer Or Laptop
- Internet Connection
Who This Course is For
- Anyone looking For A Career in Data Analytics or Business Intelligence
- Students looking for a comprehensive Training For Data Analytics with Power BI
- Anyone who works with Microsoft Power BI Even if you've never used a Data Analytics with Power BI
Your Instructor
A.M.A.M Mubeen (Expert In Tally & Finance & Microsoft Office & Power BI)
400K+ Students | 800K+ Enrolments | 200+ Countries
4.2 Instructor Rating
11,818 Reviews
415,803 Students
26 Courses
Related Courses
More free Business courses you might be interested in
 Free 100% Off
31 January 2026
Limited Time
Free 100% Off
31 January 2026
Limited Time
Profitable Broiler Farming: Step-by-Step Guide
Master Housing, Feeding, Disease Control & Farm Management
 Free 100% Off
12 January 2026
Limited Time
Free 100% Off
12 January 2026
Limited Time
Full AI Course 2026: ChatGPT, Midjourney, Gemini, Firefly!
Learn 20+ AI Tools | ChatGPT, Custom GPTs, Prompt Engineering, Gemini, Midjourney, Notion AI, MS Co…
 Free 100% Off
12 January 2026
Limited Time
Free 100% Off
12 January 2026
Limited Time
Smart Money Trading : Become A Profitable Trader In Nasdaq
Learn How To Trade US Indices Market Like Big Banks By Experienced Trading Mentors : Full Guide Of …
 Free 100% Off
03 January 2026
Limited Time
Free 100% Off
03 January 2026
Limited Time
AI for Problem Solving Skill Excellence
Use AI for Problem Identification & Framing, Root Cause Analysis (RCA), Creative Idea Generation, E…
Never Miss a Coupon!
Subscribe to our newsletter to get daily updates on the latest free courses.