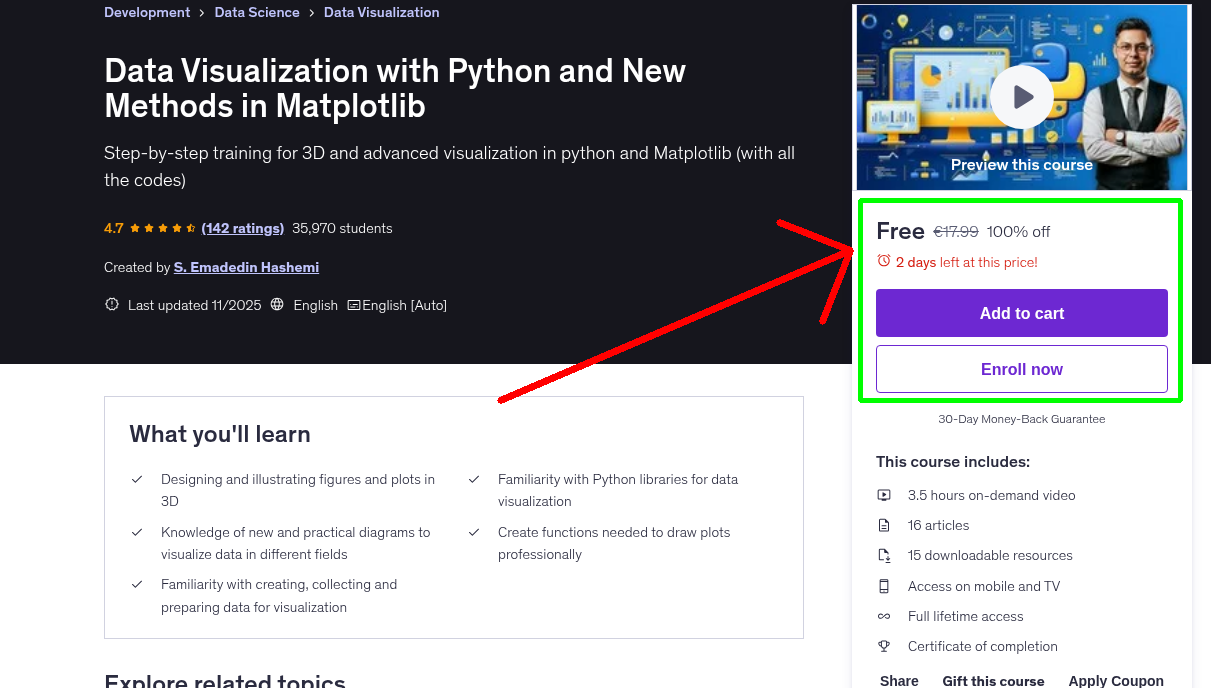
What You'll Learn
- Designing and illustrating figures and plots in 3D
- Familiarity with Python libraries for data visualization
- Knowledge of new and practical diagrams to visualize data in different fields
- Create functions needed to draw plots professionally
- Familiarity with creating, collecting and preparing data for visualization
Requirements
- No programming experience needed. You will learn everything you need to know.
Who This Course is For
- Developers
- Data Analysts
- Data Scientists
- Students
- Researchers
- Managers
Your Instructor
S. Emadedin Hashemi
AI Expert and Data Scientist
4.4 Instructor Rating
939 Reviews
103,725 Students
4 Courses
Related Courses
More free Python courses you might be interested in
 Free 100% Off
Yesterday
Expires in 3 days
Free 100% Off
Yesterday
Expires in 3 days
Python
English
Become Experts in Python | Exercises | Projects | Quiz
Python Programming | 200+ Python Exercises | Python Projects
 Free 100% Off
Yesterday
Expires in 3 days
Free 100% Off
Yesterday
Expires in 3 days
Python
English
Python Programming: Build a Strong Foundation in Coding
Develop a solid foundation in coding with Python programming and gain the skills to build robust ap…
 Free 100% Off
Yesterday
Expires in 3 days
Free 100% Off
Yesterday
Expires in 3 days
Python
English
Python Programming: Build and Deploy Your Own Applications.
Python Programming: Master the complete application lifecycle: Build, test, and deploy your Python …
 Free 100% Off
Yesterday
Expires in 3 days
Free 100% Off
Yesterday
Expires in 3 days
Python
English
HTML 5 With Quizzes And Python 3 Complete Course
Python 3 : Learn HTML5 with Quizzes, Explore Python Basics and Advanced Concepts in a Comprehensive…
Never Miss a Coupon!
Subscribe to our newsletter to get daily updates on the latest free courses.