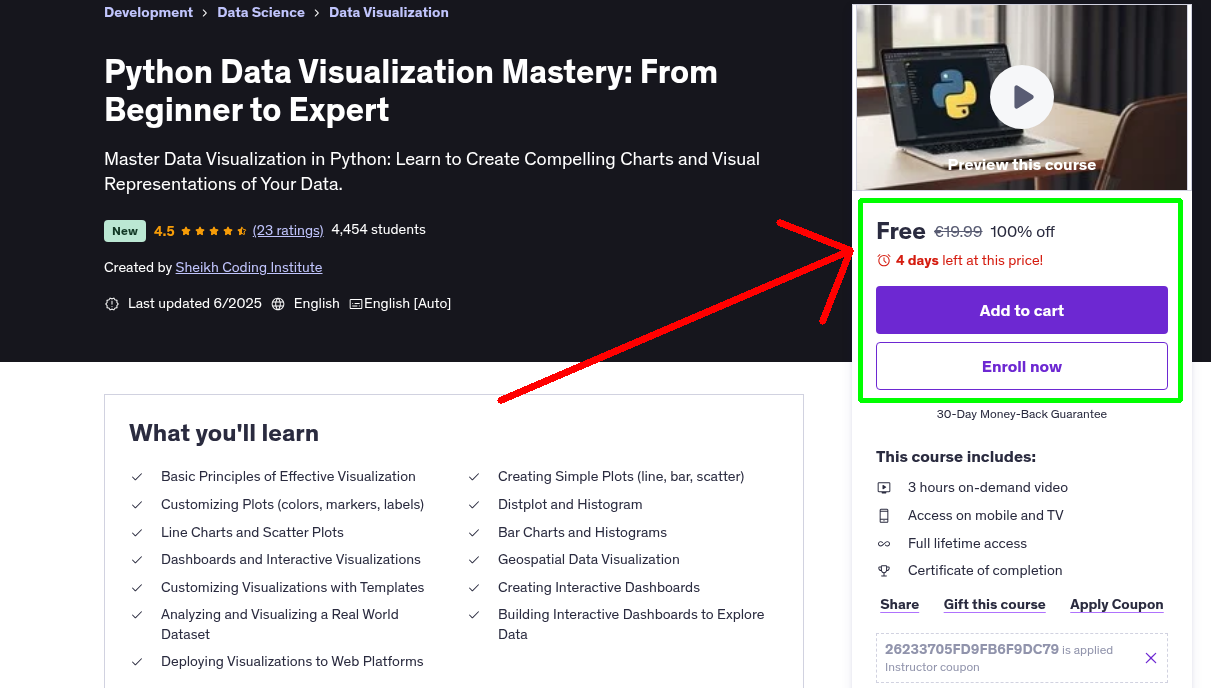
What You'll Learn
- Basic Principles of Effective Visualization
- Creating Simple Plots (line, bar, scatter)
- Customizing Plots (colors, markers, labels)
- Distplot and Histogram
- Line Charts and Scatter Plots
- Bar Charts and Histograms
- Dashboards and Interactive Visualizations
- Geospatial Data Visualization
- Customizing Visualizations with Templates
- Creating Interactive Dashboards
- Analyzing and Visualizing a Real World Dataset
- Building Interactive Dashboards to Explore Data
- Deploying Visualizations to Web Platforms
Requirements
- No prior data visualization experience is required
- Basic understanding of Python programming (variables, data types, loops, functions).
Who This Course is For
- Anyone looking to gain insights from data
- Aspiring Data Scientists & Analysts
- Researchers & Students: Effectively present your findings and make your data more accessible.
Your Instructor
Sheikh Coding Institute
Instructor at Udemy
4.2 Instructor Rating
720 Reviews
44,502 Students
11 Courses
Related Courses
More free Machine Learning courses you might be interested in
 Free 100% Off
Yesterday
Expires in 2 days
Free 100% Off
Yesterday
Expires in 2 days
N8N: AI Agent Creation Guide
Create intelligent, memory-driven AI agents using N8N, and connect them with tools like Gmail, Goog…
 Free 100% Off
Yesterday
Expires in 2 days
Free 100% Off
Yesterday
Expires in 2 days
Kling AI Guide: How to Make Videos Using Generative AI
Build real-world applications using Kling AI: from content creation and productivity to creative wo…
 Free 100% Off
Yesterday
Expires in 2 days
Free 100% Off
Yesterday
Expires in 2 days
Mastering Video Editing with AI ChatGPT for Content Creators
Supercharge Your Video Editing: Use AI ChatGPT to Generate Scripts, Titles, Descriptions, and Even …
 Free 100% Off
Yesterday
Expires in 2 days
Free 100% Off
Yesterday
Expires in 2 days
Inteligencia Artificial y Herramientas TIC para Docentes
(EducaTech IA) Herramientas Digitales e Inteligencia Artificial para Docentes
Never Miss a Coupon!
Subscribe to our newsletter to get daily updates on the latest free courses.