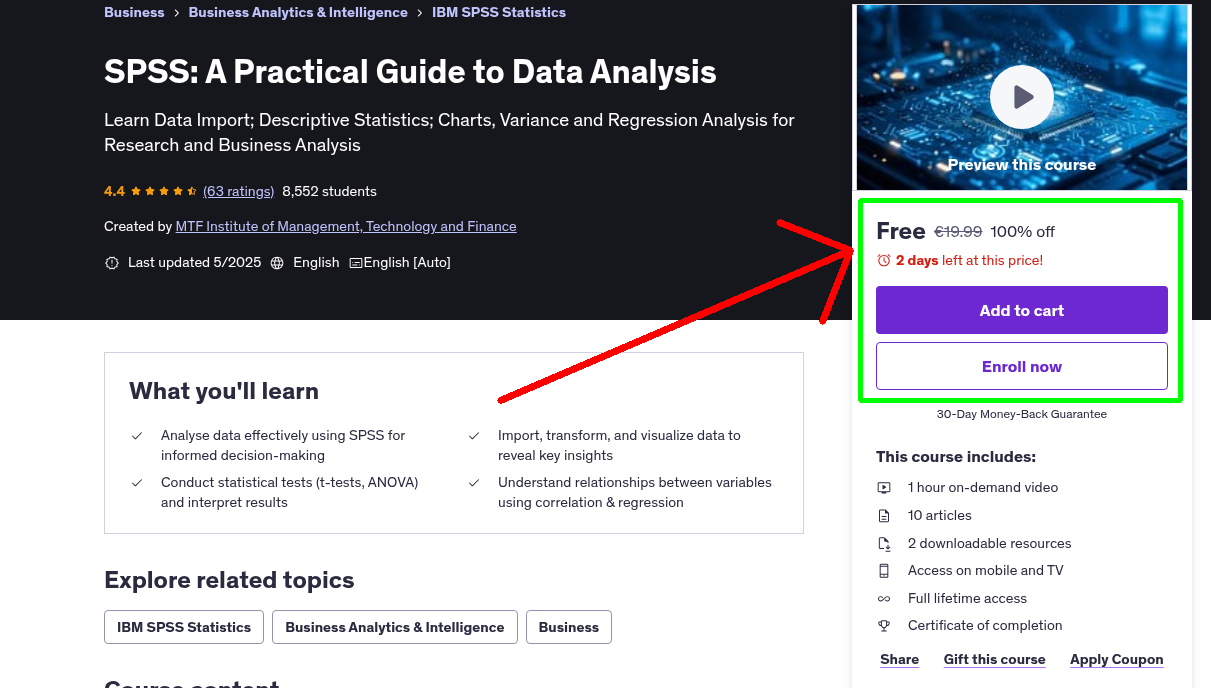
What You'll Learn
- Analyse data effectively using SPSS for informed decision-making
- Import, transform, and visualize data to reveal key insights
- Conduct statistical tests (t-tests, ANOVA) and interpret results
- Understand relationships between variables using correlation & regression
Requirements
- For a better learning experience, we suggest you to use a laptop / mobile phone / pen and paper for taking notes, highlighting important points, and making summaries to reinforce your learning.
- Basic computer literacy and a willingness to learn data analysis. No prior statistics knowledge is required.
Who This Course is For
- Students, researchers, and professionals who need to analyze data for reports, theses, or business decisions.
- Unlock the power of your data with this practical IBM SPSS course! Designed for beginners and intermediate learners, this course takes you step-by-step from importing your raw data into IBM SPSS to confidently interpreting and presenting your findings. You'll gain hands-on skills in essential SPSS techniques, enabling you to extract meaningful insights for your research, academic projects, or professional reports. We'll start with the fundamentals: navigating the SPSS environment and efficiently importing data from various sources. You'll then master descriptive statistics to summarise and understand your data's basic characteristics. Learn to create compelling and informative charts and graphs to visualize patterns and trends.
- This course goes beyond the basics, equipping you with essential data transformation methods to prepare your data for analysis. You'll delve into the world of relationships between variables, exploring correlations and regression. You'll also learn to perform t-tests and ANOVA to compare group means, and gain an introduction to powerful multivariate analysis techniques. But this course isn't just about running the numbers. A core focus is on interpreting your SPSS output correctly. You'll learn to move beyond simply reporting p-values, and instead, focus on effect sizes, confidence intervals, and the practical significance of your results. This will enable you to tell a compelling and data-driven story. By the end of this course, you'll be equipped with the SPSS skills and the interpretive expertise to confidently analyze data, communicate your findings effectively, and make data-backed decisions.
Your Instructor
MTF Institute of Management, Technology and Finance
Institute of Management, Technology and Finance
4.4 Instructor Rating
101,718 Reviews
970,653 Students
274 Courses
Related Courses
More free Business courses you might be interested in
 Free 100% Off
Today
Expires in 1 day
Free 100% Off
Today
Expires in 1 day
Gestión del Tiempo y Timeboxing en Negocios y Organizaciones
Dominio del Timeboxing y Gestión del Tiempo: Potenciando la Productividad y la Eficiencia en los Ne…
 Free 100% Off
Today
Expires in 1 day
Free 100% Off
Today
Expires in 1 day
Disruptive Thinking: Innovation, Creativity, Transformation
Challenge Assumptions, Break Traditional Patterns, Apply Disruptive Innovation Across Industries Th…
 Free 100% Off
Today
Expires in 1 day
Free 100% Off
Today
Expires in 1 day
Data Storytelling: Communicating Data Insights Effectively
Data Storytelling in Data Analysis: Communicate Insights, Visualize Data, Craft Narratives and Driv…
 Free 100% Off
Today
Expires in 1 day
Free 100% Off
Today
Expires in 1 day
Operations and Process Management Data Analysis & Analytics
Data Analysis and Analytics best practices in Operations and Process Management, Operational Manage…
Never Miss a Coupon!
Subscribe to our newsletter to get daily updates on the latest free courses.